The latest research, insights, tools, and resources that make managing a digital shop easier,
Agency Triage Part One: Assessment
TL;DR
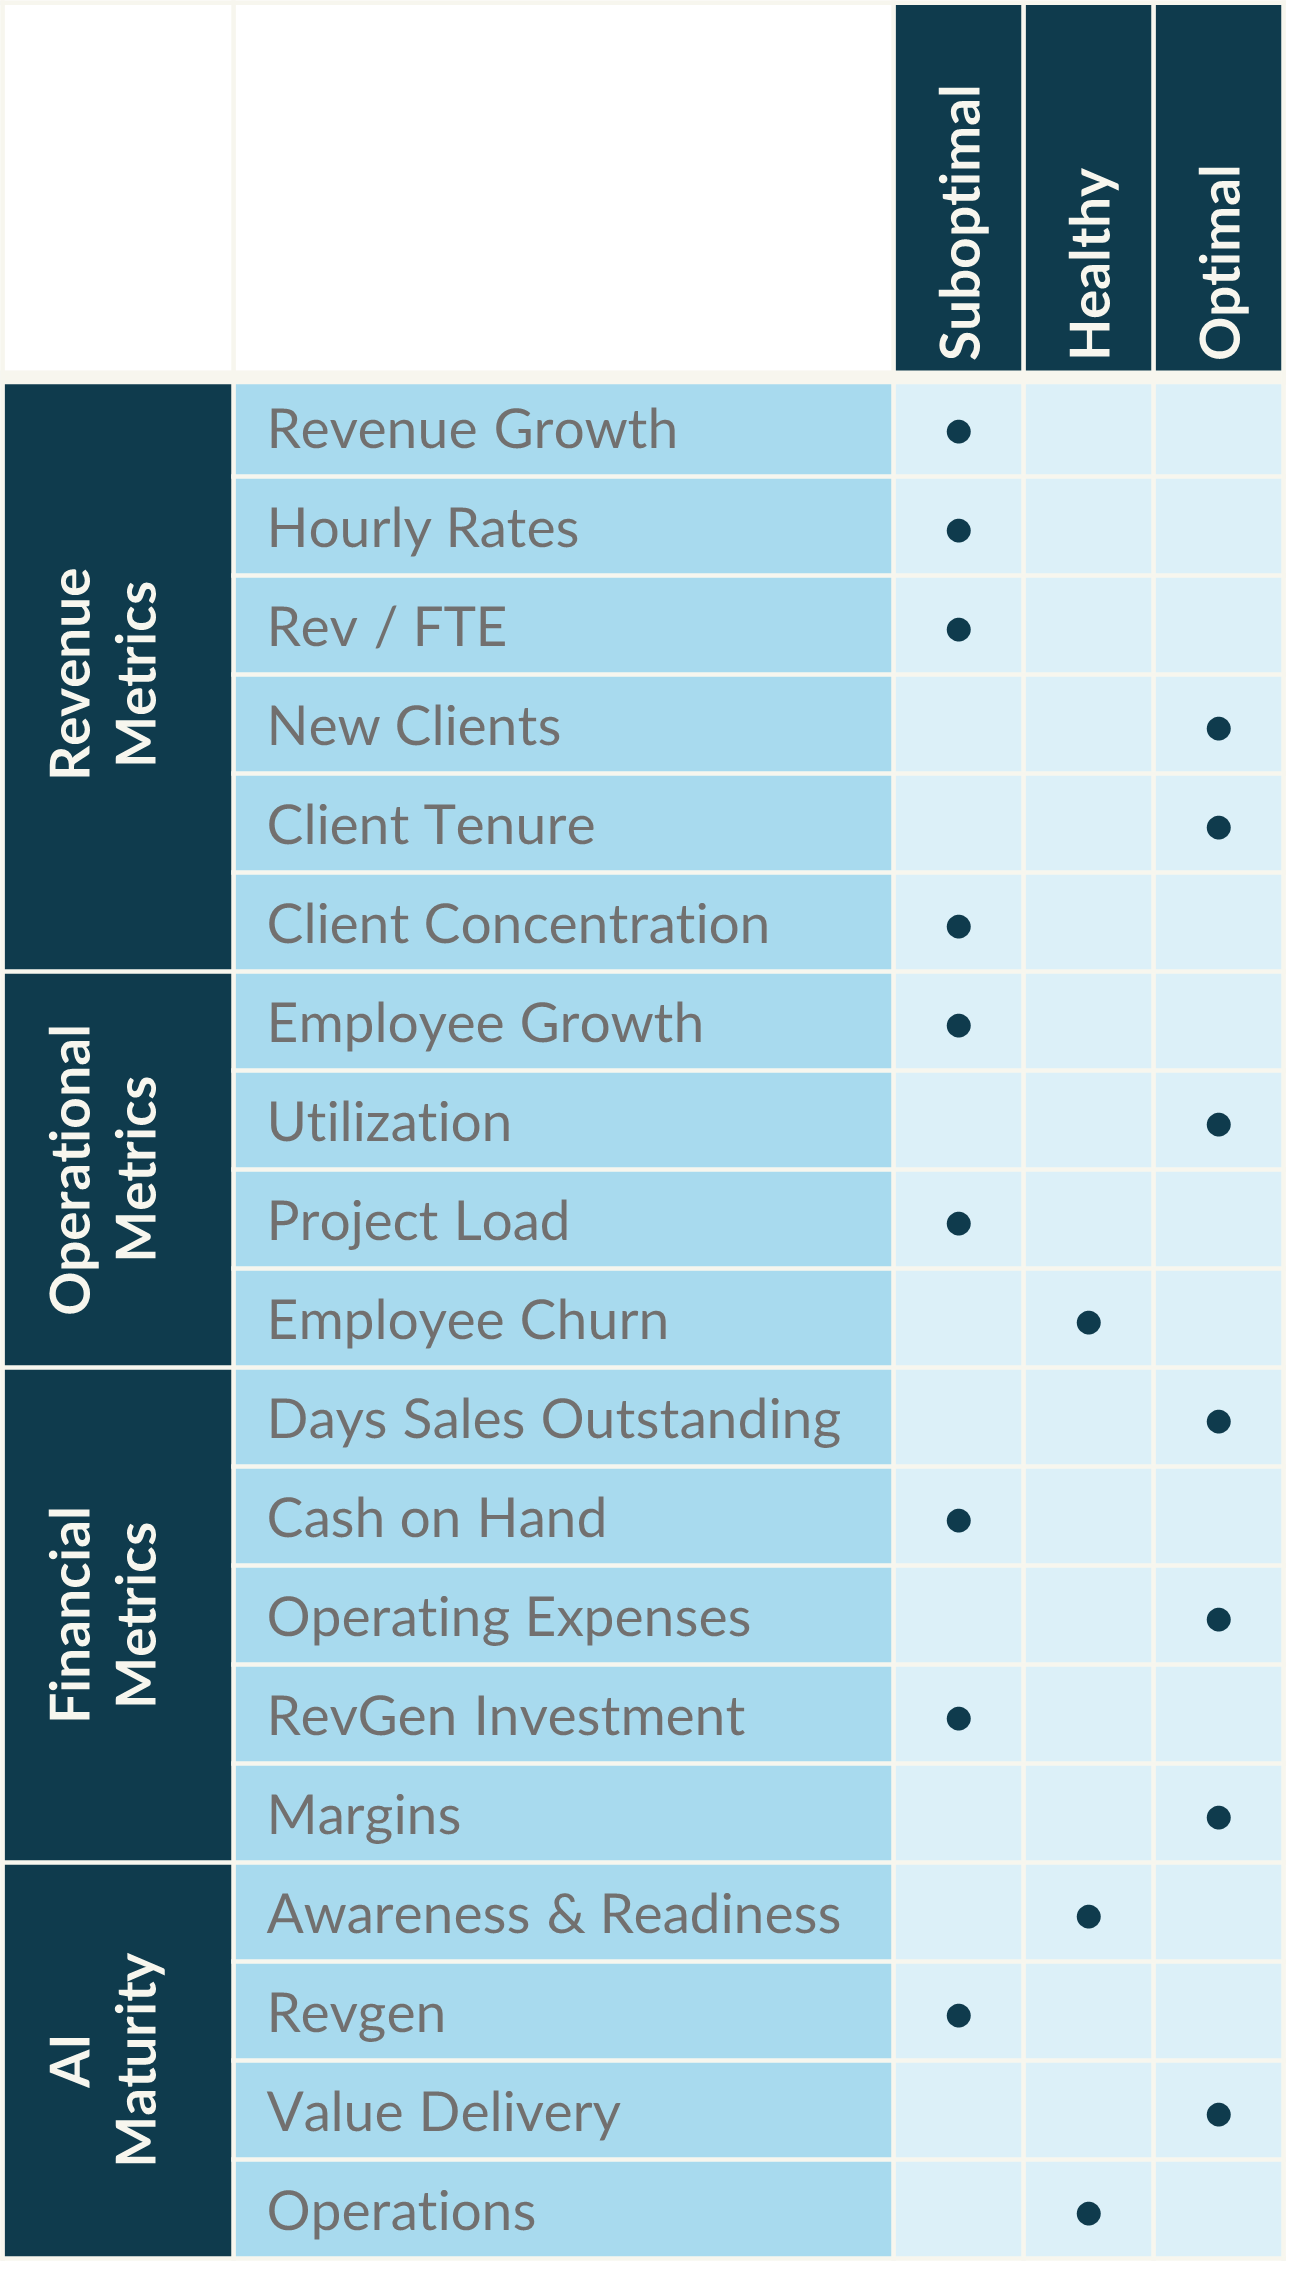
Agency Triage: Part One AssessmentThe easiest way to identify issues at an agency is benchmarking. It’s one of the first steps I take when building growth strategies because it tells me where to dig deeper. Here’s what I evaluate, some questions I ask, and some notes on implications: RevgenRevenue growth
Hourly rates
Rev/FTE
New clients
Client tenure
Client concentration
OperationsEmployee growth
Utilization
Project load
Employee churn
FinancialDays sales outstanding
Cash on hand
Operating expenses
Revgen investment level
Margins
That’s not an exhaustive list, and it’s not meant to be. We’re doing the initial tirage here. We need a high-level scan to guide the next level of evaluation. After doing this 100+ times over the last decade, this list has surfaced a lot. Where to Find the DataUnfortunately, quality data on these isn’t easy to come by. This is the main reason why Promethean exists. Back when we started in 2015, there was even less available. I published some data in a previous newsletter. Then, there’s our industry primer, which has more and a number of time series for historical reference. Finally, we do a State of Digital Services Study annually that hits most of the high points. (keep an eye out; we’re fielding this year’s study in a few weeks). Those should get you most of the way there. After saying “I used to offer benchmarking” in my last newsletter, I received a few replies asking when I’d reopen the service. The issue is that it’s a fully manual process. I’d spend a sizable amount of time assessing each metric and then evaluating them as a whole so I could provide actionable guidance. That said, I’m not reopening the service broadly. However, if you’re reading this newsletter and need benchmarks to help triage your agency, reply to this email, and we’ll set something up. It'll follow our standard benchmarking service, and you can find all the details here. What if We Don't Track Those?Some shops, especially those needing tirage, aren’t tracking many of these metrics. What to do in that case will have to wait until Agency Triage Part Two: Revgen. The spoiler's in the title. Start with (profitable) revgen. I'll dig into some of the core components of agency revgen and tests you can run to see how your agency stacks up. ✌️Until next time, - Nick |
Research & Strategy for Digital Agencies
The latest research, insights, tools, and resources that make managing a digital shop easier,
TL;DR SURVEY CLOSING: The State of Digital Services 2026 survey closes Monday, 3/9. Be sure to participate before then to get access to the full report and live readout webinar. Agencies have largely stopped hiring entry-level and junior talent since 2022-23. That gap will show up later as a shortage of mid-level and senior practitioners. At the same time, AI is absorbing the kind of repetitive production work juniors used to do across coding, marketing, and design. Senior talent remains...
TL;DR The 2026 State of Digital Services Survey is live! Participate and get the results for free. We received more interest than expected in our new Revgen 2.0 service, so we will need to move to a waitlist for now. Join the list if you'd like to spend time on something OTHER than constant revgen challenges. AI is increasing pricing pressure, and discounting or “value engineering” scope often leaves clients with work that doesn't deliver the outcome they want. A Minimum Effective Engagement...
Building Reliable Revgen Machines Progress meetings suck when you're missing targets. They suck even more when it happens multiple times in a row. We've seen too many leadership teams have these conversations quarter after quarter for years now. So, we're designing a new service to help agency teams quickly find and fix key revgen issues. It includes a full review of an agency's: Leadership vision, alignment, and goals Positioninig Roles and responsibilities Brand Service mix Pricing...